
Day Trading Graphs Analysis: How StocksScanner Visualizes EOD Signals for Analysis
Day trading graphs serve as the visual compass that guides successful traders through the often turbulent and unpredictable landscape of financial markets. These charts are not just graphical representations of price action—they are dynamic tools that provide crucial insights into market behavior, helping traders anticipate shifts and react swiftly. Through the use of candlestick patterns, volume trends, and technical indicators such as moving averages, RSI, and MACD, day traders can identify optimal entry and exit points with precision.
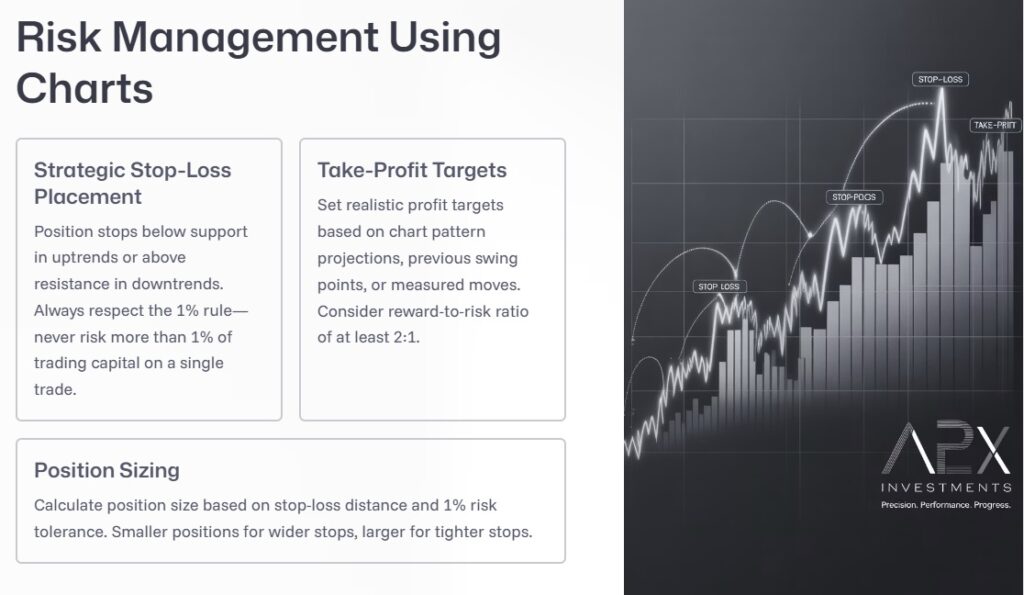
By analyzing short-term price fluctuations across different timeframes—ranging from one-minute to fifteen-minute intervals—traders can gauge momentum, spot breakouts, and detect signs of reversals before they fully develop. Graph analysis also aids in risk management, allowing traders to set informed stop-loss levels and define profit targets based on visual support and resistance zones.
In the fast-paced world of day trading, where seconds can make the difference between profit and loss, the ability to read and interpret trading graphs efficiently is not just an advantage—it’s a necessity. Mastery of chart analysis empowers traders to make data-driven decisions, reduce emotional bias, and maintain a consistent strategy amidst constant market noise.
Type of Day Trading Charts
Day trading charts are essential tools that help traders visualize market movements and make informed decisions quickly. Among the simplest is the line chart, which connects closing prices over a selected timeframe to create a continuous line. While it lacks detailed price data, its simplicity makes it ideal for identifying long-term market trends and overall directional movement. It’s especially useful for traders who prefer a clean, uncluttered view of price action.
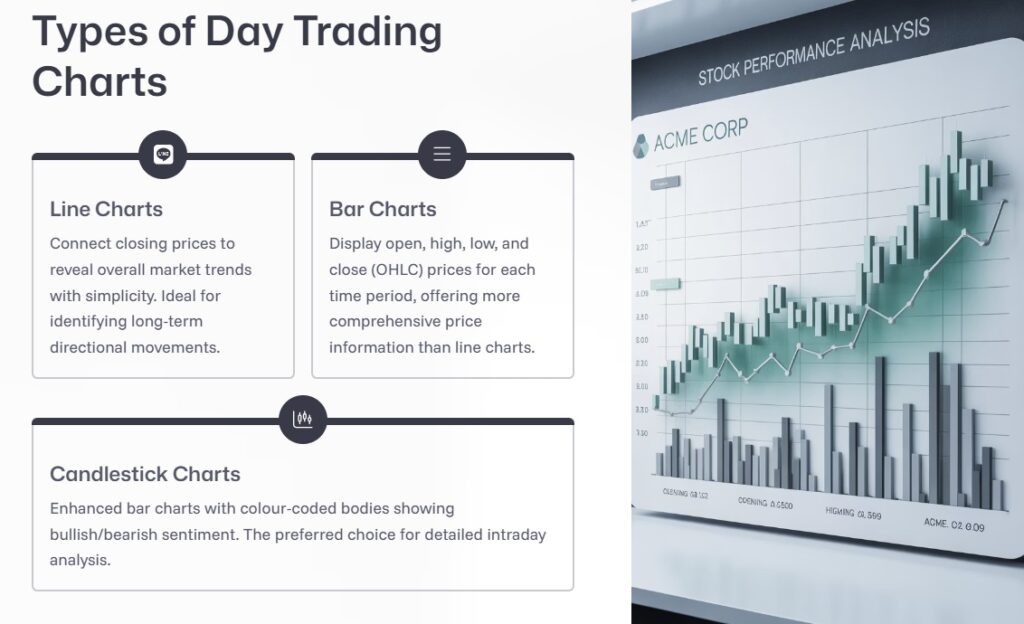
For more detailed analysis, traders often turn to bar charts and candlestick charts. Bar charts display the open, high, low, and close (OHLC) for each time period, offering greater insight into price volatility and range. Candlestick charts, an enhanced version of bar charts, go further by using color-coded bodies to indicate bullish or bearish sentiment, making it easier to interpret market psychology at a glance. Their ability to reveal patterns and potential reversals makes them the preferred choice for most intraday traders who require both precision and speed in their decision-making.
Key Elements of Trading Charts
Understanding the key elements of trading charts is essential for interpreting market behavior, as they reveal critical data points like price movements, trends, and potential reversal signals. These elements help traders make informed decisions by offering a visual breakdown of market dynamics over time.
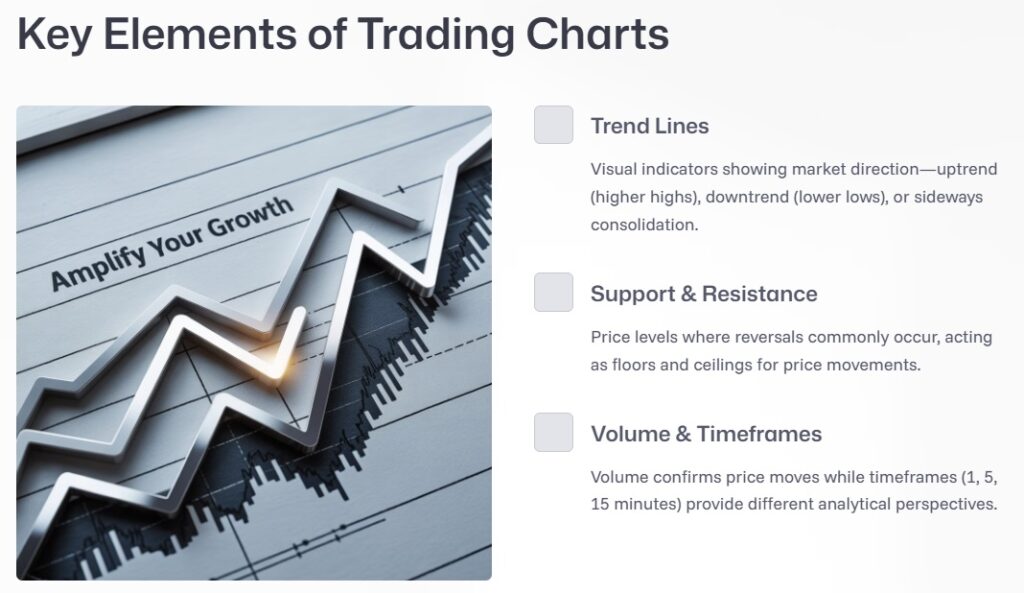
Among the most important features are trend lines, which connect a series of price points to illustrate the direction of the market—uptrend, downtrend, or sideways. Support and resistance levels are also vital, indicating price zones where buying or selling pressure tends to halt or reverse movements. Another crucial component is volume, which shows the number of shares or contracts traded during a given period and helps confirm the strength of price moves. Lastly, the timeframe selected (e.g., 1-minute, 5-minute, or hourly) significantly affects the level of detail shown and the type of strategy applied, with shorter timeframes favoring quick trades and longer ones supporting broader analysis.
Why Day Trading Graphs Matter in Modern Market Analysis
Day trading graphs are essential for spotting intraday trends, reversals, and price action. Unlike long-term investing charts, these graphs are usually focused on 1-minute to 15-minute intervals and are loaded with indicators like moving averages, RSI, and volume overlays. They serve as a visual interface between raw market data and the trader’s decision-making process. Being able to read and analyse these graphs efficiently can mean the difference between profit and loss.
Effective day trading requires more than just data access; it demands a sophisticated level of analysis that traditional tools may not provide. Most platforms offer plug-and-play charting tools, but they often lack the intelligence to interpret market sentiment or anticipate potential movements. That’s where platforms like StocksScanner come in, using artificial intelligence to enhance what the graphs can tell us, especially during critical EOD periods.
Interpreting Volume & Trends
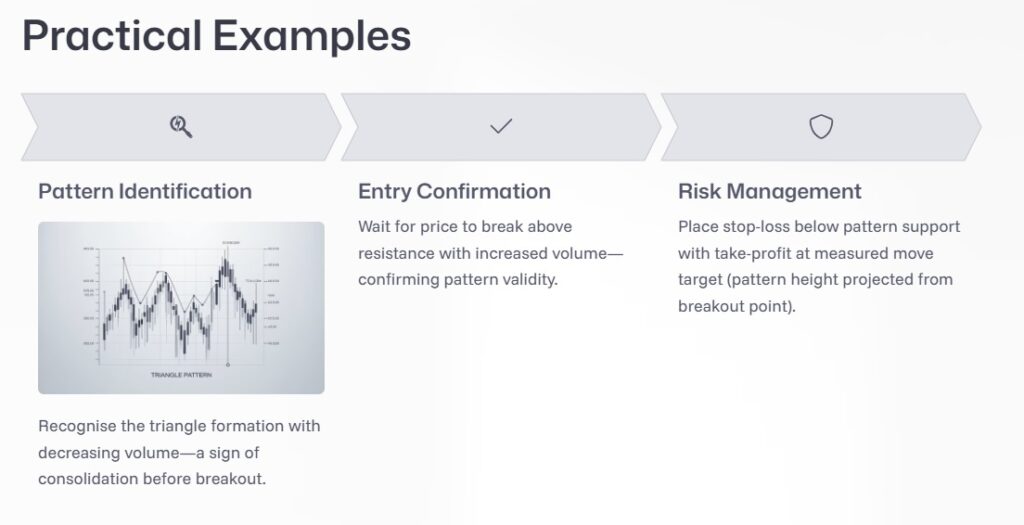
Interpreting volume and trends is a fundamental skill in day trading, as it provides deeper insight into the strength and sustainability of price movements. Volume confirms price action, meaning that a strong move in price backed by high trading volume is more likely to be genuine and sustainable. During the formation of chart patterns—such as triangles or flags—volume typically decreases, reflecting market indecision. However, a sharp increase in volume during a breakout acts as confirmation, signaling strong trader commitment and increasing the likelihood of follow-through. Conversely, when there is a divergence between price and volume—such as rising prices accompanied by falling volume—it may indicate weakening momentum and a potential reversal ahead.
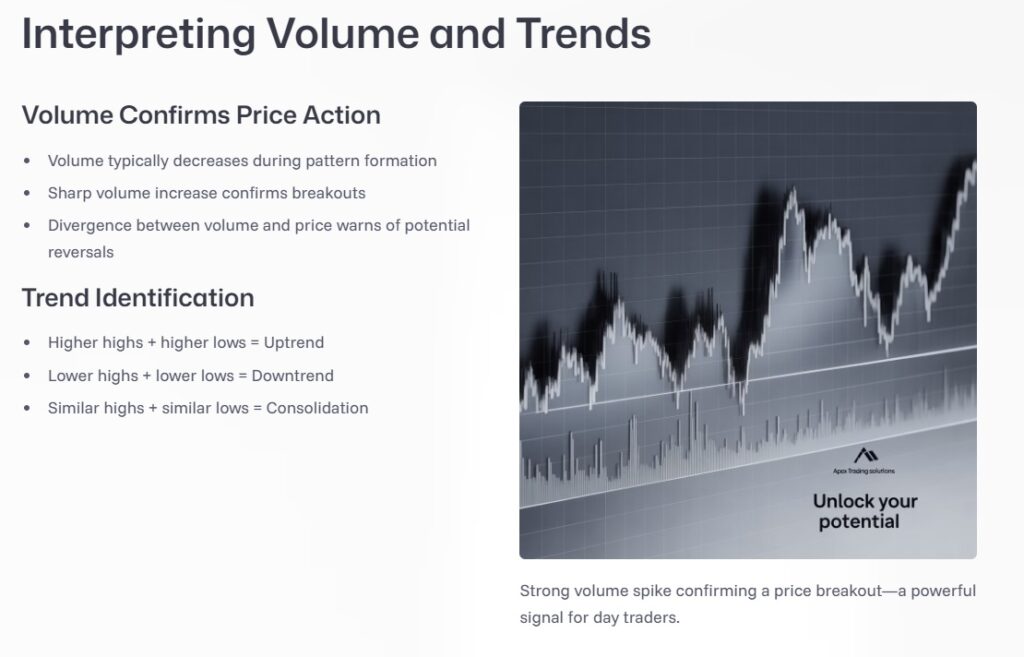
Identifying trends through price structure is equally important. An uptrend is marked by a sequence of higher highs and higher lows, while a downtrend consists of lower highs and lower lows. Periods of consolidation, where price forms similar highs and lows, suggest indecision or balance between buyers and sellers. Recognizing these patterns helps traders align their strategies with market direction. When a strong volume spike accompanies a breakout from consolidation, it is often seen as a powerful trading signal, giving day traders confidence to enter positions with favorable risk-to-reward potential.
The Role of EOD Signals in Day Trading Strategy
End-of-day signals are a significant component of many short-term trading strategies. These signals help traders interpret how a stock or asset performed by the close of the markets, setting the stage for the next trading day. Analysing EOD data can uncover vital cues about institutional behaviour, final-hour reversals, or pricing anomalies that only develop late in the trading session.
Without proper interpretation and context, EOD signals can be easily misread. Traditional graphs might show a spike or dip, but they rarely tell the complete story. StocksScanner takes this a step further by using its proprietary algorithms to interpret these closing data points within a broader market narrative. This allows day traders not only to see what happened but understand why it happened, based on machine-learning analysis of comparable historical patterns.
How StocksScanner Enhances Day Trading Graphs Analysis
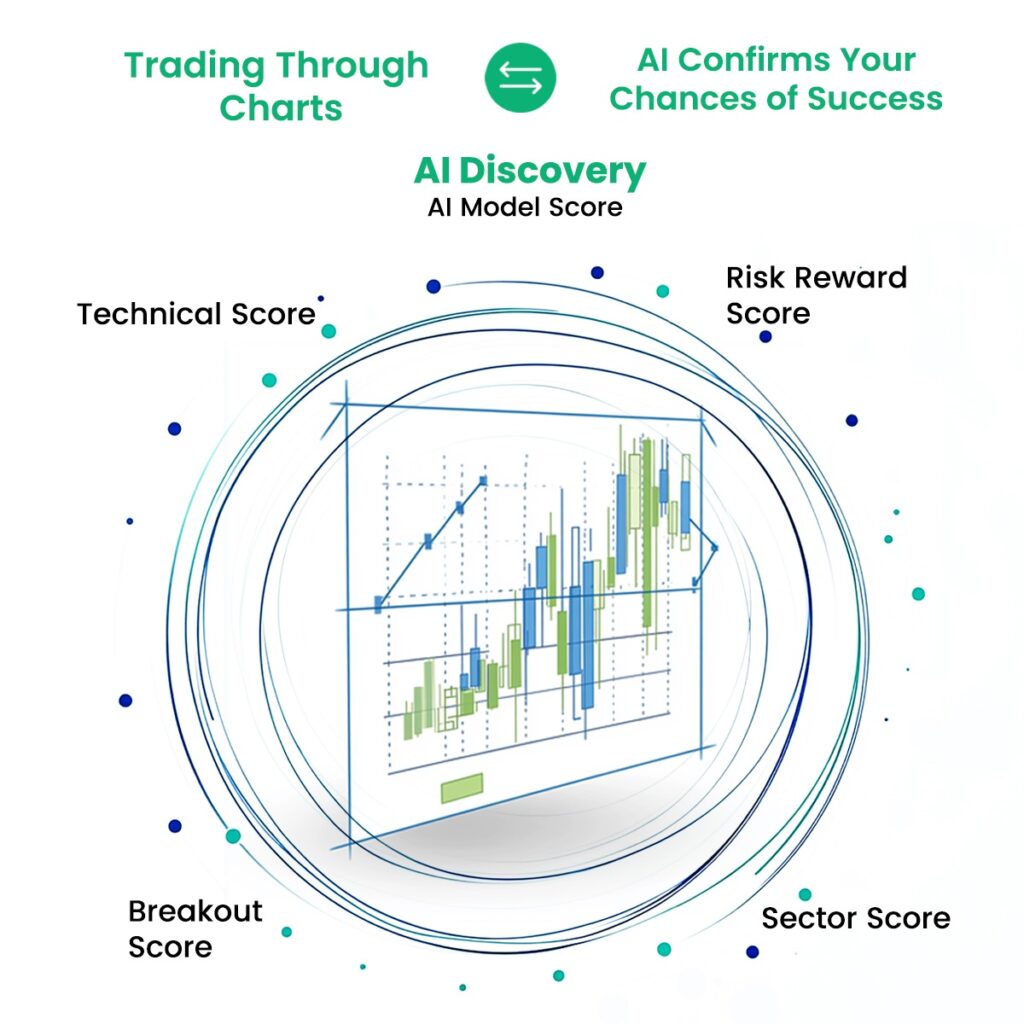
StocksScanner brings a fresh, intelligent layer to trading graphs by using trained AI models to evaluate EOD signals against historical data, current market sentiment, and technical patterns. Instead of simply displaying price action, the platform’s visualisation tools interpret that action through contextual overlays and predictive modelling.
Visual Representation of Predictive Algorithms
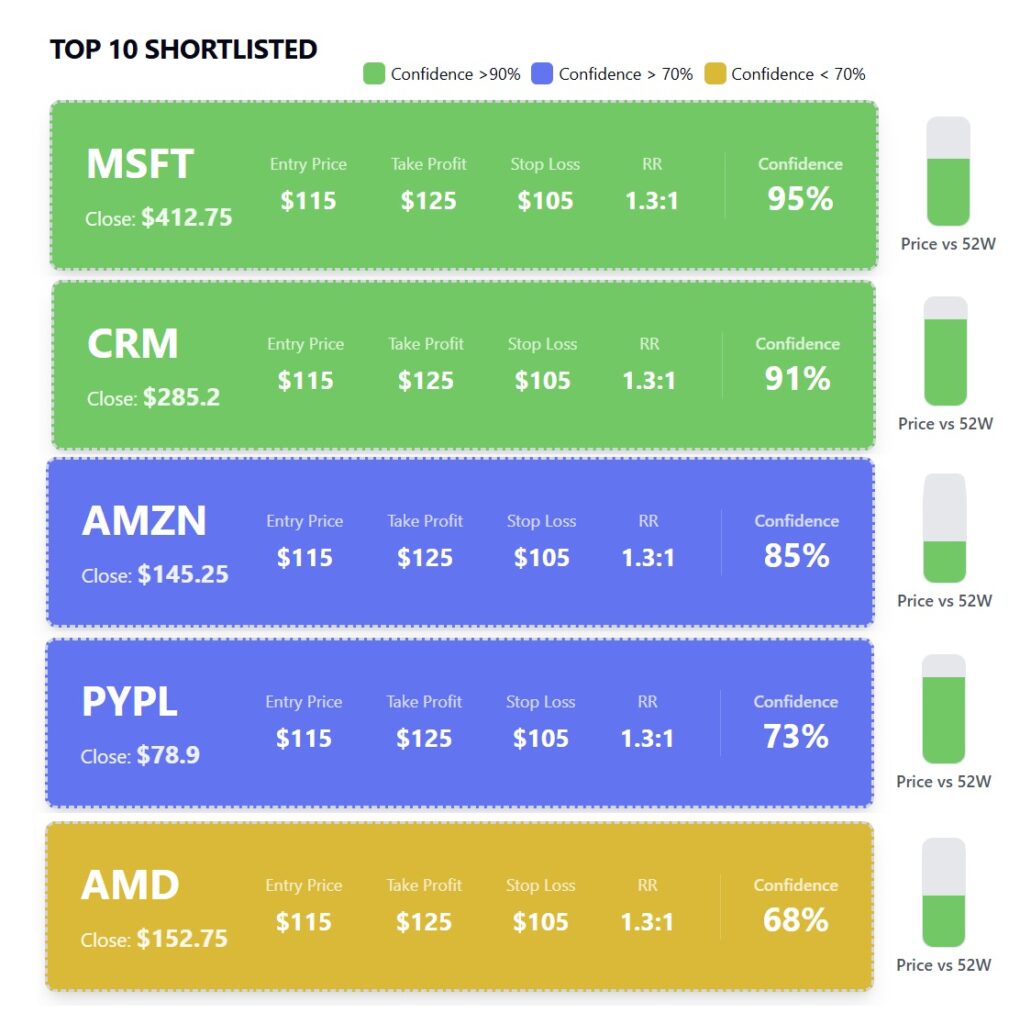
One of StocksScanner’ strengths lies in how it visually represents complex data. Rather than burden traders with raw numbers, the platform translates signal strength, confidence levels, and prediction zones directly onto the chart. A trader can immediately see how likely a particular EOD movement is to carry momentum into the next day’s session. This seamless integration of prediction and visualisation reduces analysis time and increases trading efficiency.
Building Confidence Through Accurate Graph-Based Analysis
Understanding and trusting your data is paramount in trading. StocksScanner increases this confidence with graphs that do more than reflect movement—they suggest probable outcomes. Visual cues such as colour-coded zones, trend line trajectories informed by AI, and comparative pattern recognition allow the trader to validate or question their assumptions in context.
Day trading graphs analysis becomes more effective when supplemented with intelligent recommendations. Algorithms trained on thousands of previous trading days highlight anomalies or repeat behaviour that could suggest breakout or correction patterns. The inclusion of AI in this analysis adds a predictive layer that traditional charting tools simply don’t offer.
The Human-AI Collaboration in Day Trading
Despite all the power that artificial intelligence brings to trading graphs, the final decision still lies with the human trader. StocksScanner doesn’t aim to replace the trader, but to empower them with better, faster, and more accurate insights. It enhances the way traders read EOD signals by contextualising data points visually and analytically, offering scenarios and probabilities rather than static figures.
This synergy between human intuition and machine-based forecasting is what gives StocksScanner an edge in the realm of day trading graphs analysis. Traders who embrace this hybrid approach often find that they make more consistent, confident decisions, especially when working with volatile EOD data.
Conclusion: Redefining How We See Market Data
StocksScanner is changing the game for how traders interpret day trading graphs, especially with its focus on visualising EOD signals in a meaningful way. By fusing artificial intelligence with advanced charting techniques, it enables a new level of clarity, accuracy, and speed in day trading analysis. As the trading world continues to evolve, platforms that offer predictive, interactive, and contextual data visualisation like StocksScanner will become essential tools for anyone looking to maintain a competitive edge.
In a market where every second counts, having the ability to see not just the what but the why and the what-next is invaluable. With tools like StocksScanner, day traders are no longer left staring at static candles and trying to guess the future—they’re reading real-time insights, derived from powerful, intelligent analysis.