
Reading Between the Candles: AI Chart Analysis for Smarter Decisions
Financial markets communicate through a complex language of patterns—formed by price action, volume, and volatility. For decades, traders have relied on traditional technical analysis to interpret these signals, often using tools like candlestick patterns, trendlines, and moving averages. While these methods remain foundational, AI chart analysis is now transforming how we decode the market’s message, offering faster, deeper, and more accurate insights—especially for UK retail investors seeking an edge.
AI-driven platforms can analyse millions of data points across thousands of stocks in seconds, identifying subtle, multi-variable patterns that are nearly impossible for the human eye to spot. According to a recent report by PwC, over 52% of financial services firms in the UK are already integrating AI into their trading and analytics workflows, with adoption accelerating. Technologies such as machine learning and natural language processing allow these systems to not only read charts, but also factor in real-time news sentiment, economic indicators, and historical performance to deliver smarter trade signals.
As AI continues to evolve, retail traders now have access to tools that were once reserved for institutional desks—bridging the gap between instinct and intelligence, and making market decisions more data-driven than ever before.
The Evolution of Technical Analysis
Technical analysis has undergone a dramatic transformation—from the days of hand-drawn charts and gut instinct to today’s era of advanced machine learning algorithms. What was once considered more of an art form has now become a data-driven science, with AI Trading Chart Analysis elevating pattern recognition to levels never before possible.
In the past, early chartists relied on years of experience and intuition to spot trends and interpret market signals. However, their methods were limited by human perception and the volume of data they could feasibly analyse. Today, AI-powered systems can process billions of data points across multiple timeframes, asset classes, and indicators in real time. These models not only detect known chart patterns like head and shoulders or double tops but can also uncover non-obvious, high-probability patterns and price anomalies invisible to human analysts.
According to a 2024 survey by Deloitte, over 60% of financial institutions now use machine learning to inform trading strategies, citing improved accuracy and faster decision-making as primary benefits. This shift from manual interpretation to intelligent automation marks a new era—where retail and professional traders alike can harness the power of AI to make more confident, objective, and timely trading decisions.

How AI transform Chart Analysis?
AI Chart Analysis refers to the application of artificial intelligence technologies in interpreting, predicting, and generating insights from technical charts used in financial markets. These charts, such as candlestick, line, and bar charts, illustrate price action over time, traditionally requiring years of experience and market intuition to decipher. AI, however, is rapidly altering that landscape.

Through machine learning and vast data processing capabilities, AI algorithms can now scan thousands of candle patterns in real-time, identifying high-probability setups that human traders might overlook. The technology looks beyond just shape or size—it interprets consistency, volatility, market sentiment, and macroeconomic context, turning technical analysis into something part-science, part-intuition, and now part-machine.

Why Traditional Chart Reading Has Limitations
While seasoned traders may swear by their tried-and-tested chart patterns—like the double top, head and shoulders, or doji—relying solely on human interpretation is fraught with challenges. One major limitation is emotional bias. Traders may “see” patterns that aren’t there simply because they expect them to be. Moreover, screen fatigue and cognitive overload can lead to missed opportunities or misread signals in fast-moving markets.

Traditional methods also struggle with scale. A human can analyse a handful of assets at a time in one market, whereas AI Chart Analysis can process thousands of instruments simultaneously across global indices, commodities, crypto assets, and forex with high accuracy.
How AI Chart Analysis Works
Pattern Recognition Powered by Machine Learning
At the core of AI Chart Analysis lies pattern recognition driven by sophisticated machine learning models. These algorithms are trained on vast historical datasets that include millions of chart configurations. Over time, the AI “learns” which patterns tend to precede certain price movements and how market conditions impact their reliability.
For example, a recurrent bullish engulfing pattern might statistically yield a 2% move upward when accompanied by high trading volume and low volatility in a specific market. The AI can flag this insight instantly, without a trader needing to manually verify previous occurrences or conditions.
Sentiment Analysis and Contextual Awareness :
AI doesn’t stop at the chart. It often integrates wider market data, including macroeconomic indicators, breaking news, and social sentiment. By combining technical chart analysis with these external factors, AI provides a contextual lens through which to refine trade execution. A technical signal may be strong, but if broader market indicators are bearish, the AI may recommend caution or a reduced position size.
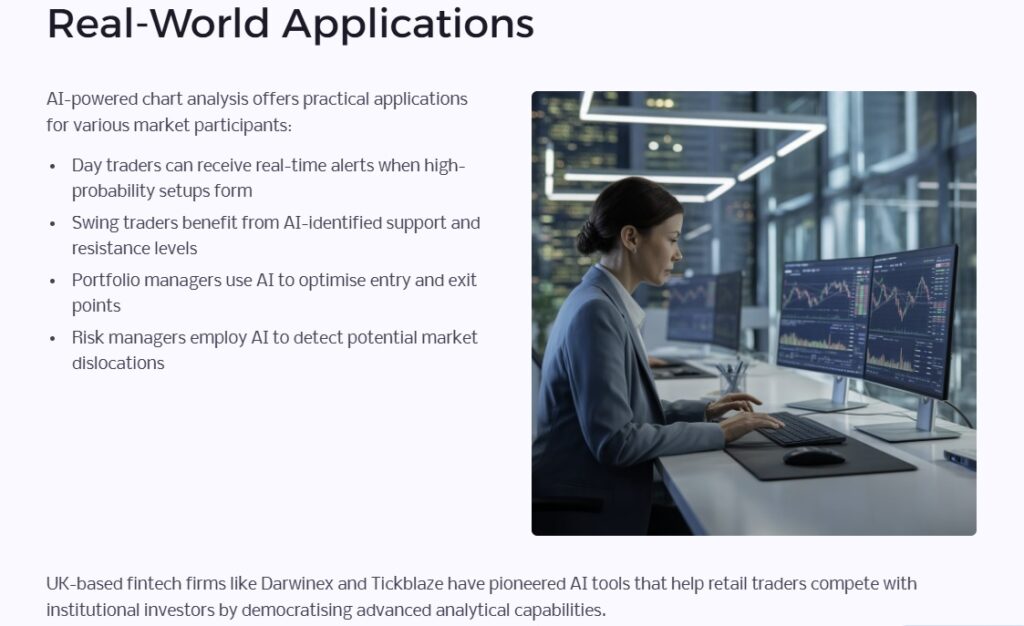
Practical Applications for Smart Traders
For retail traders, AI Chart Analysis tools are becoming more accessible than ever, embedded in platforms ranging from brokerage dashboards to standalone apps. With just a few clicks, users can generate predictive models, observe pattern probabilities, and receive real-time alerts when specific chart formations appear.

Institutional traders, hedge funds, and quant teams are going further, building custom AI models to detect micro-signals in high-frequency data. Some are using reinforcement learning algorithms that adjust strategies dynamically based on feedback from trade outcomes—effectively allowing AI to “learn” and improve with every trade placed.
The Human-AI Trading Partnership
Despite its impressive capabilities, AI Chart Analysis is not about replacing the human trader. Rather, it serves as a powerful assistant—one that is immune to emotion, fatigue, or bias. The best results often come from combining human intuition with algorithmic precision. A trader can use AI insights as a foundation to validate their own analysis or challenge assumptions they might have missed.
Moreover, as AI continues to evolve, the synergy between man and machine is expected to deepen. Traders who embrace this partnership stand to gain the most in terms of performance, accuracy, and efficiency.
Risks and Considerations
While AI Chart Analysis offers tremendous potential, it’s not infallible. Algorithms are only as good as the data they consume and the assumptions they’re built on. Overfitting, data bias, or mislabelled inputs can skew predictions. Additionally, unexpected geopolitical or macroeconomic events can disrupt even the most accurate pattern forecasts.
This reinforces the need for traders to maintain a level of vigilance. Blind trust in AI can be just as risky as ignoring it altogether. Successful implementation requires continuous monitoring, technical understanding, and a willingness to question model outputs from time to time.
The Future of Trading with AI Chart Analysis
As AI continues to integrate deeper into financial systems, AI Chart Analysis is poised to become a standard tool in every trader’s arsenal. With its ability to distil complex data into actionable signals, it enhances both speed and confidence in trade execution. The gap between data-rich insights and real-time decision-making is shrinking, empowering traders of all levels to act smarter and faster.

Looking ahead, we’ll likely see AI models that are not just responsive but anticipatory—forecasting market shifts before they manifest visually on a chart. This proactive dimension of AI may redefine what it means to “read between the candles” in the coming years.
Conclusion
AI Chart Analysis is no longer the future of trading—it’s the present. Whether you’re a novice seeking to simplify technical analysis or an expert aiming to scale your strategy, embracing AI can significantly elevate your trading edge. By learning to interpret market data through the intelligent lens of artificial intelligence, traders can achieve deeper clarity, heightened precision, and, ultimately, smarter decisions. The question now is not if you should use AI, but how soon you’ll start making it a core part of your trading journey.